Application Insights Instrumentation
- Automatic Instrumentation
- Autoinstrumentation supported environments and languages
- Experiences
- Manual Instrumentation
- OpenTelemetry Distro
- Application Insights SDK (Classic API OpenCensus)
Automatic instrumentation (enable without code changes)
What are the autoinstrumentation advantages?
- Code changes aren't required. ✅
- Access to source code isn't required. 🕵️♂️
- Configuration changes aren't required. ⚙️
- Ongoing SDK update maintenance is eliminated. 🔄
Autoinstrumentation supported environments and languages here
Experiences
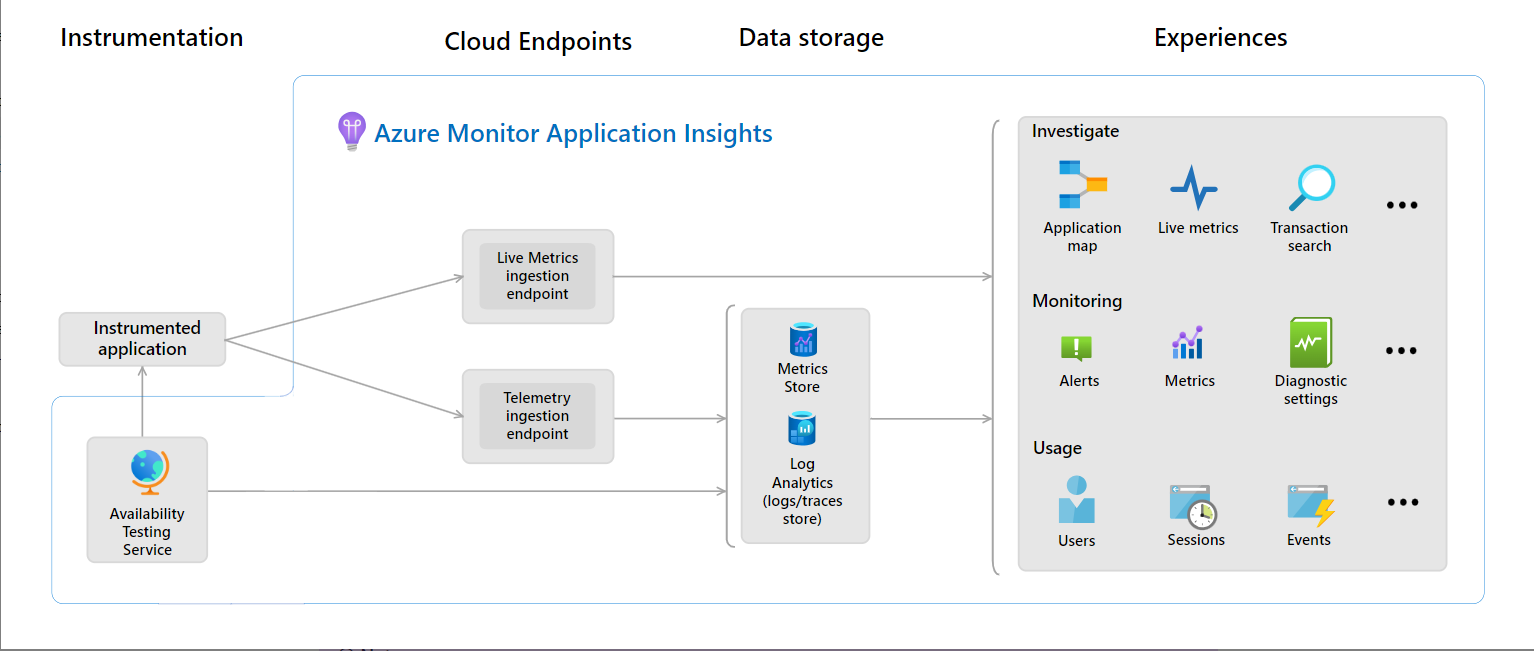
Investigate
- Application dashboard: An at-a-glance assessment of your application's health and performance.
- Application map: A visual overview of application architecture and components' interactions.
- Live metrics: A real-time analytics dashboard for insight into application activity and performance.
- Transaction search: Trace and diagnose transactions to identify issues and optimize performance.
- Availability view: Proactively monitor and test the availability and responsiveness of application endpoints.
- Failures view: Identify and analyze failures in your application to minimize downtime.
- Performance view: Review application performance metrics and potential bottlenecks.
Monitoring
- Alerts: Monitor a wide range of aspects of your application and trigger various actions.
- Metrics: Dive deep into metrics data to understand usage patterns and trends.
- Diagnostic settings: Configure streaming export of platform logs and metrics to the destination of your choice.
- Logs: Retrieve, consolidate, and analyze all data collected into Azure Monitoring Logs.
- Workbooks: Create interactive reports and dashboards that visualize application monitoring data.
Usage
- Users, sessions, and events: Determine when, where, and how users interact with your web app.
- Funnels: Analyze conversion rates to identify where users progress or drop off in the funnel.
- Flows: Visualize user paths on your site to identify high engagement areas and exit points.
- Cohorts: Group users by shared characteristics to simplify trend identification, segmentation, and performance troubleshooting.
Code Analysis
- Profiler: Capture, identify, and view performance traces for your application.
- Code optimizations: Harness AI to create better and more efficient applications.
- Snapshot debugger: Automatically collect debug snapshots when exceptions occur in .NET application.
Logic model
The logic model diagram visualizes components of Application Insights and how they interact.
